
README.md 3.8 KB
Spring-boot + JDBC (MySQL) example
Purpose
This project aims at demonstrating how to instrument legacy code based on the SpringBoot framework and a MySQL JDBC connection.
We are using the opentracing contributions in order to trace:
- All the JDBC queries and calls to the DB
- All incoming HTTP calls
The instrumentation is injected via the Datadog Java Agent. Java agents allows developers to execute some code before starting the legacy application. All operations for instrumenting the code are done at this time.
Run the demo
The demo consistes into a very simple backend backed by a MySQL db. The Spring Boot application exposes 2 endpoints that can be reached via an HTTP request.
Prerequisites
- Run the latest version of Datadog Agent. For instance, you can run it through a docker container:
docker run -d --name dd-agent -v /var/run/docker.sock:/var/run/docker.sock:ro -v /proc/:/host/proc/:ro -v /sys/fs/cgroup/:/host/sys/fs/cgroup:ro -e API_KEY=<YOUR-API-KEY> -e SD_BACKEND=docker -p 8126:8126 -P datadog/docker-dd-agent:latest
Run the application
The first step is to edit the Spring configuration file and the Datadog Tracer file and check if the connection properties are okay.
# file: src/resources/application.properties

spring.datasource.driver-class-name= io.opentracing.contrib.jdbc.TracingDriver
spring.datasource.url= jdbc:tracing:mysql://localhost:3306/springdb
spring.datasource.username=root
spring.datasource.password=root
# file: src/resources/dd-trace.yaml

# Service name used if none is provided in the app
defaultServiceName: spring-app

# The writer to use.
writer:
  type: DDAgentWriter
  host: localhost
  port: 8126

# The sampler to use.
sampler:
  type: AllSampler
Then, is to run the Spring Application along the Datadog Java Agent.
- So first download the
jarfile from the main repository.
NOTE: While in beta, the latest version is best found on the Snapshot Repo.
# download the latest published version:
wget -O dd-java-agent.jar 'https://search.maven.org/remote_content?g=com.datadoghq&a=dd-java-agent&v=LATEST'
Then add the following JVM argument when launching your application (in IDE, using Maven/Gradle run or simply in collaboration with the
>java -jarcommand):-javaagent:/path/to/the/dd-java-agent.jarFinally, build and run the application with the
javaagentoption. (Note, actual flag set inspring-boot-jdbc.gradle)cd path/to/dd-trace-examples/spring-boot-jdbc ./gradlew bootRun -Pjavaagent=/path/to/the/dd-java-agent.jar
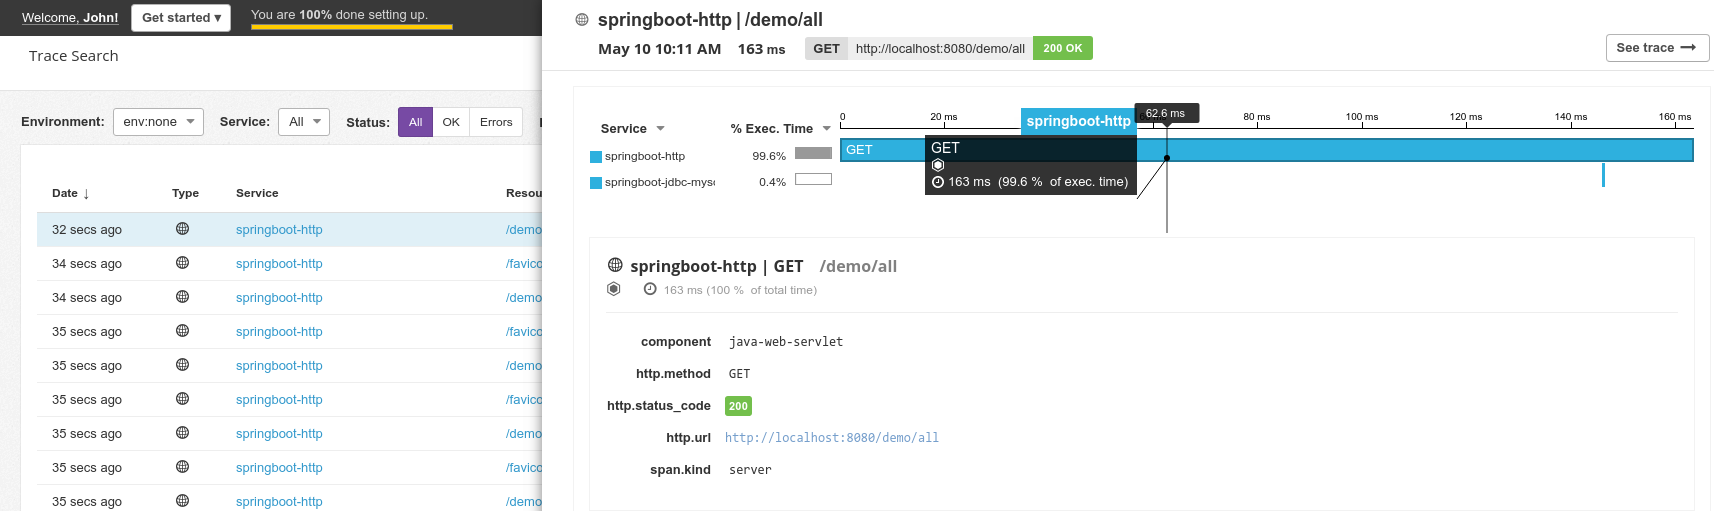
Generate traces
Once the application runs. Go to the following urls:
Then, you will able to see traces directly to the DataDog UI.
How did we instrument this project?
If you want to instrument your own code (Spring-boot and JDBC based), here is how you should do it.
Dependencies
Auto-instrumentation with the dd-trace-agent
The instrumentation is entirely done by the datadog agent which embed a set of rules that automatically recognizes & instruments:
- The java servlet filters
The datadog agent embeds the open tracing java agent.
JDBC is not automatically instrumented yet by the agent. So you should follow the instructions on the next section.
JDBC tracing configuration
Just edit your application.properties file
and add :tracing right after the jdbc string as shown below.
spring.datasource.url= jdbc:tracing:mysql://localhost:3306/springdb